 Living Beings
Compare species
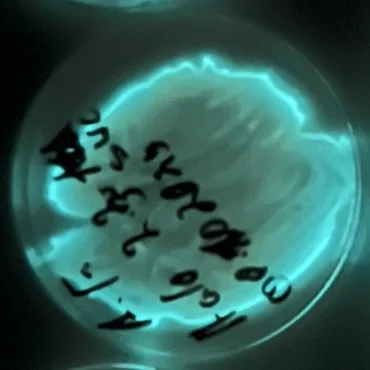
Aliivibrio fischeri
Aliivibrio fischeri
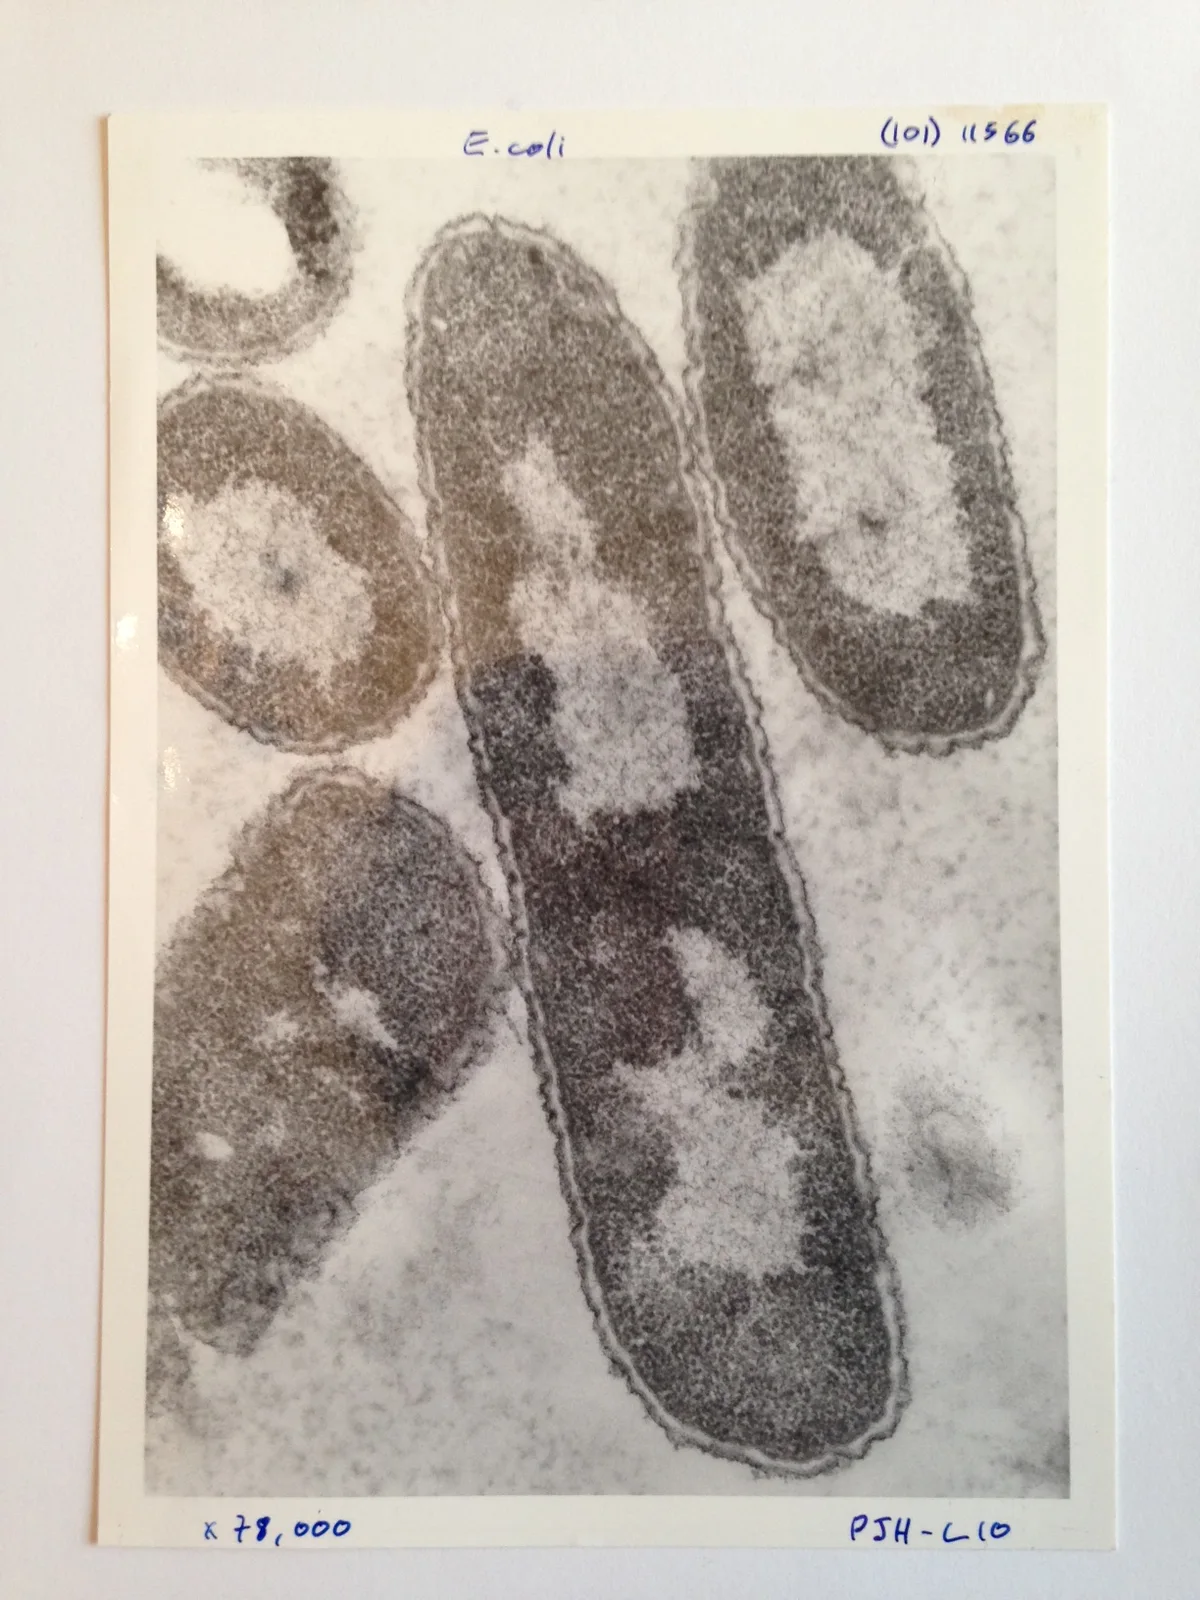
Escherichia coli
Escherichia coli
How to compare two organisms
Choose two species and trace their closest shared group. Then compare a trait with the same definition on each side. Check the units, life stage and context before interpreting a measurement or range.
Missing data means that the collection lacks a sourced value. Where a characteristic does not apply to a lineage, the comparison labels it separately. Open the two profiles for context and follow their sources before drawing a conclusion.
Biological comparison
Means, ranges and reported maxima describe different things. Check the source and population before comparing values.
Classification
Shared ancestry
Closest shared taxon · Gammaproteobacteria.
Separate lineages
| Characteristic | Aliivibrio fischeri | Escherichia coli |
|---|---|---|
Scientific measurements | Scientific measurements | |
| No reference measurements are available for this pair. | ||
Context-specific measurements | Context-specific measurements | |
| Cell length | Not recorded |
1.94–2.72 µm
Reported range · Study strain E. coli B · Laboratory study · Context-specific record Source and measurement contextReported range across sample mean cell lengths in a laboratory study of a strain of E. coli B. The endpoints do not define the range of individual cells or of the species. Length of a single cell under the reported conditions.
|
Natural history | Natural history | |
| Nutrition and energy acquisition |
Organic substrates support metabolism. Conditions inside a host can differ substantially from those in surrounding seawater. Source 1 ↗ |
No separate account recorded |
| Habitat |
Marine environmental phases and specialized host-associated sites provide distinct growth conditions. Source 1 ↗ |
E. coli can occur in intestinal tracts, water, food and other environments. Water monitoring uses counts of E. coli as …E. coli can occur in intestinal tracts, water, food and other environments. Water monitoring uses counts of E. coli as an indicator of fecal contamination. An indicator result describes conditions in a sampled body of water and cannot by itself identify a disease-causing strain or the origin of the contamination. |
| Geographic distribution |
Environmental and host-derived strains have documented collection localities. The origin of one experimental strain does not define the full range. Source 1 ↗ |
No separate account recorded |
| Morphology |
Small bacterial cells require microscopy for direct observation. Light emission is a physiological property, not a visible body-color diagnosis. Source 1 ↗ |
The species name refers to a group of bacteria whose strains cannot be distinguished by ordinary rod shape alone. A micrograph is useful for seeing cell form, but strain identity and gene content require other evidence. Source 1 ↗ |
| Reproduction and life cycle |
Cell multiplication and repeated opportunities for host colonization connect free-living and symbiotic phases. Source 1 ↗ |
No separate account recorded |
| Ecological role |
The well-studied squid association demonstrates a microbial contribution to an animal's light-producing system. The Hawaiian bobtail squid carries luminous bacteria …The well-studied squid association demonstrates a microbial contribution to an animal's light-producing system. The Hawaiian bobtail squid carries luminous bacteria in a light organ on its underside. Jones and Nishiguchi measured the squid adjusting the light it emitted in response to light coming from above. Matching the background this way reduces the dark silhouette an observer below would otherwise see. The experiment explains one natural partnership in which bacterial light becomes part of an animal’s camouflage. |
Some E. coli types occur as ordinary members of intestinal microbial communities. Others carry traits associated with illness. The presence …Some E. coli types occur as ordinary members of intestinal microbial communities. Others carry traits associated with illness. The presence of the species name in a sample does not by itself identify the strain or establish that it caused disease. |
| Behavior and activity |
Chemical signaling and population context influence light production and other behaviors relevant to colonization. Source 1 ↗ |
No separate account recorded |
| Environmental adaptations |
Bioluminescence, environmental sensing and colonization traits help explain the model symbiosis. Source 1 ↗ |
A genome comparison between an O157:H7 strain and a laboratory K-12 strain found shared sequence alongside regions specific to each …A genome comparison between an O157:H7 strain and a laboratory K-12 strain found shared sequence alongside regions specific to each lineage. The shared part helps explain why they are related. The differences help explain why observations about one strain should be reported with its strain name instead of being assigned to every E. coli cell. |
| Conservation |
No separate account recorded |
No separate account recorded |